

Chapter 9: Reports That Matter
The Few Numbers a Small Business Should Watch
You don't need 40 reports. Five numbers tell you whether sales are healthy, and one short sum shows which of them to work on.
Lesson 1 of 6 · 6 min read ·
A CRM can produce hundreds of charts. Most of them answer questions nobody asked. Owners tend to open the reports screen once, feel a bit overwhelmed, and go back to working from their gut.
This chapter takes the opposite approach. Pick a few numbers, understand them well and look at them often. Everything here works from a spreadsheet too, as long as you've kept the sheet up to date.
What are the five numbers to watch?
1. New leads. How many real enquiries came in this month? Count people who might buy, and leave out spam and job seekers.
2. Win rate. Of the deals that finished, what share did you win? Won deals divided by won plus lost deals.
3. Average deal size. Total value of won deals divided by the number of won deals.
4. Sales cycle. How many days does a typical won deal take from enquiry to signature?
5. Open pipeline. The total value of deals that are still live.
That's it. The first four tell you how the machine runs. The fifth tells you what's coming. Many businesses should also add one money number from the books, such as cash collected or overdue invoices, because a healthy pipeline doesn't pay the wages. Sales is the part a CRM can see, so that's what we cover here.
The sum that ties them together
Three of the five numbers multiply to give your sales.
New leads times win rate times average deal size equals sales.
Here is an invented landscaper. The numbers are made up.
| Measure | Figure |
|---|---|
| New leads this month | 40 |
| Win rate | 25% |
| Deals won | 10 |
| Average deal size | $4,000 |
| Sales this month | $40,000 |
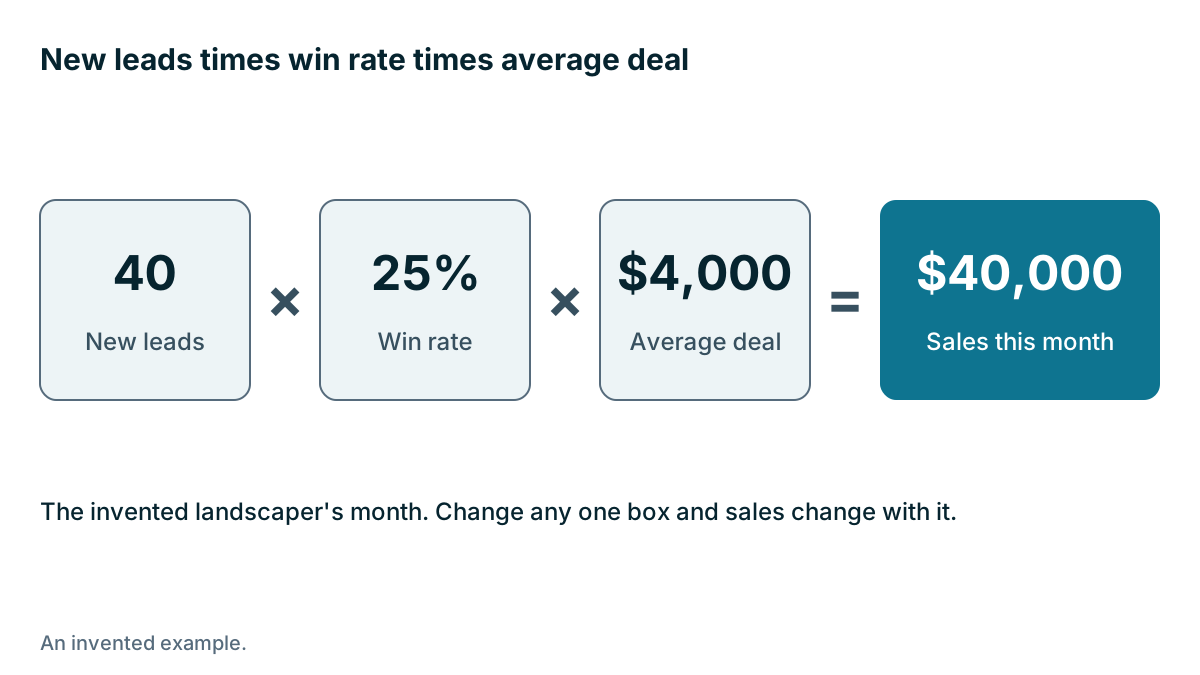
This sum shows you where to push. Look at what a modest improvement does to each box.
| Change | New sum | Sales | Gain |
|---|---|---|---|
| 10% more leads, 44 instead of 40 | 44 times 25% times $4,000 | $44,000 | $4,000 |
| Average deal up 10%, to $4,400 | 40 times 25% times $4,400 | $44,000 | $4,000 |
| Win rate up 5 points, to 30% | 40 times 30% times $4,000 | $48,000 | $8,000 |
In this example, the win rate is the strongest lever. Five points is a 20% improvement on 25, which is why the gain is bigger. It may not be the easiest one to pull, though. The point of the table is that you can now have a real discussion about where to spend your effort, and you may not need more leads at all.
Remember that those gains are revenue, not profit. A bigger job may have a better margin or a worse one, and as Chapter 6 showed, a discount that wins more deals can leave you worse off.
How much pipeline do you need?
Open pipeline tells you more when you compare it with what you need. If the landscaper wants $40,000 of sales from quotes out now, and wins about one in four by value, it needs about $160,000 of live quotes. If there's only $90,000 in the pipeline, there's a problem coming, and you found out while you can still act.
Take care with this. The number is only as good as the pipeline. If deals that died months ago are still open, the total flatters you. That's why the weekly review, which comes later in this chapter, matters.
What are leading and lagging numbers?
Sales and revenue are lagging numbers: they tell you what already happened. New leads and open pipeline are leading numbers: they tell you what's likely to happen. A sign shop with a sales cycle of 30 days that had a poor lead month in March will probably feel it in April. Watching leading numbers gives you time to do something about it.
Which numbers look good but tell you little?
Some numbers feel good and don't tell you much. They are sometimes called vanity numbers.
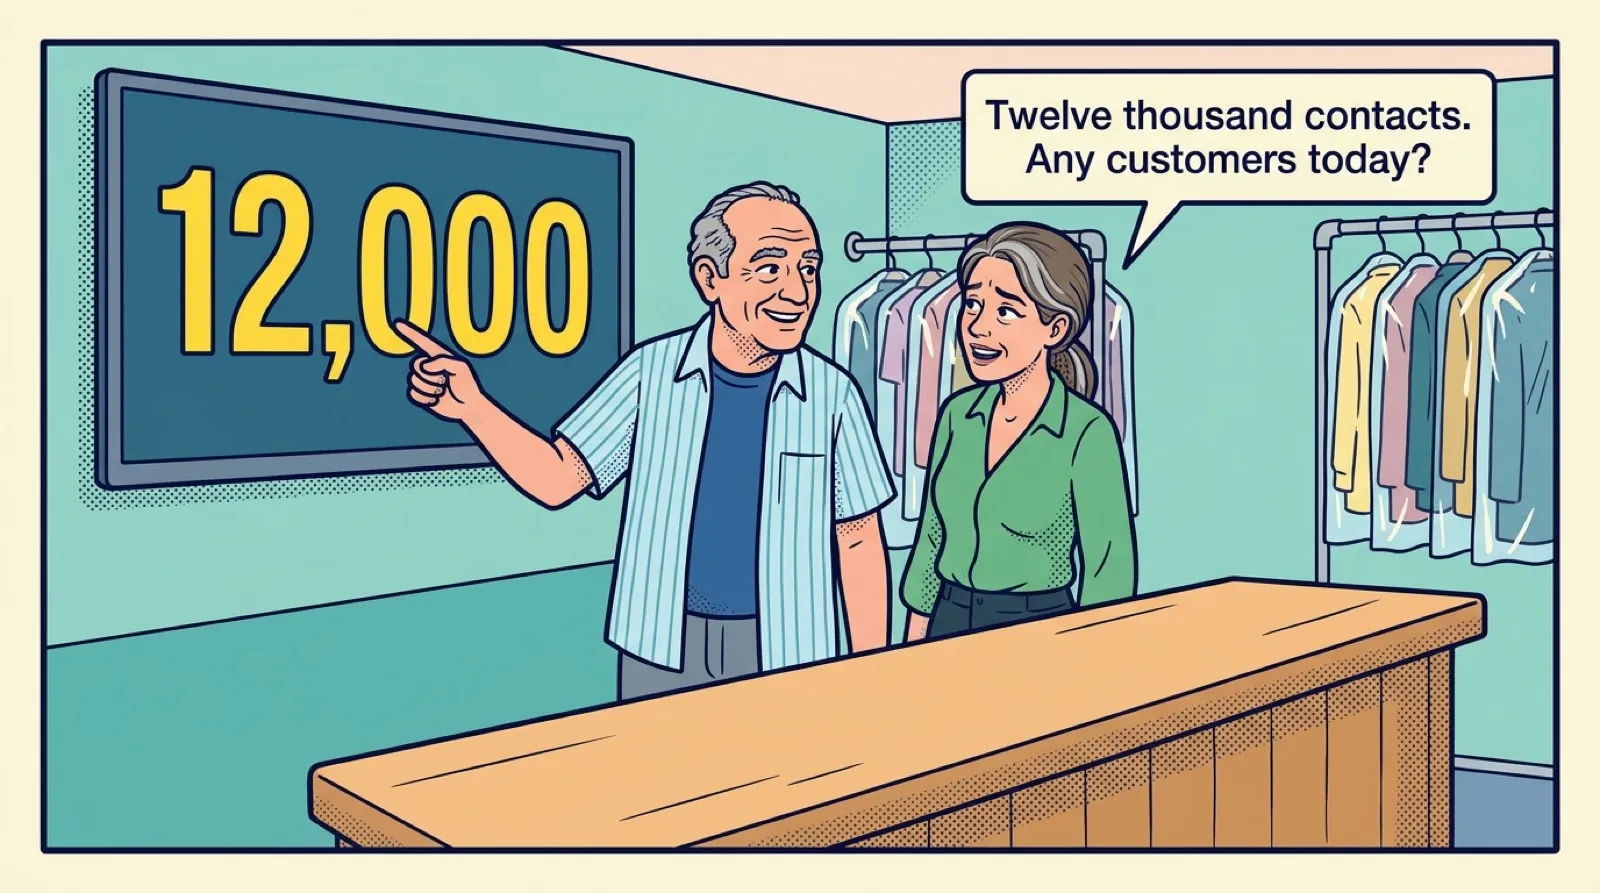
- Total contacts. A big list says nothing about whether anyone is buying.
- Calls made or emails sent. Activity counts are useful for coaching, and they are easy to inflate. They measure effort, not results.
- Website visitors. A number for your marketing person, if you have one. Leads are the number that matters here.
- Total pipeline, with no age limit. See above.
Define every number once
Your team will argue about the numbers, and that's fine. What you don't want is arguing about what they mean. Write down a short definition of each one.
- What counts as a lead, and what doesn't
- What date a deal counts on: when it's signed, or when it's invoiced
- Whether deal values are before or after tax
- How long a deal can sit before it counts as dead
- Whether repeat work counts in the same figures as new work
Those definitions will decide what you see. An HVAC firm that lumps in maintenance renewals will have a much higher win rate than one that only counts new installs. Neither is wrong, but mixing them will confuse you, and it can hide a problem in new sales.
Watch out
Be careful with industry benchmarks. Figures you see online are often from a different size of firm, trade or definition of a lead. Your own numbers from last quarter are a much better comparison, because they're measured the same way.
Where should you start?
If you are starting from nothing, start with new leads and win rate. Both need only two things to be true in your CRM: every enquiry gets recorded, and every deal gets closed as won or lost. Add the rest over the following weeks. The next lessons go through each one and how to read it.
Key takeaways
- Watch five numbers: new leads, win rate, average deal size, sales cycle and open pipeline.
- New leads times win rate times average deal size equals sales, and that sum shows you which lever matters most.
- Compare open pipeline to what you need, and keep dead deals out of it.
- Define each number once, and compare with your own past results.
Common questions
What numbers should a small business track for sales?
Track new leads, win rate, average deal size, sales cycle and open pipeline. Many businesses should also add one money number from the books, such as cash collected.
How do the sales numbers add up to revenue?
Multiply new leads by win rate by average deal size. In an invented example, 40 leads at a 25% win rate and a $4,000 average deal give $40,000 of sales.
Which sales numbers are not worth watching?
Vanity numbers such as total contacts, calls made, emails sent, website visitors and a pipeline with no age limit. They feel good but do not tell you much about sales.
Keep your place and test yourself
Enroll for free to save your progress, take the chapter quiz, and get a certificate when you pass every chapter. The lessons stay open to everyone either way.