

Chapter 9: Reports That Matter
Building a Dashboard People Read
Most dashboards get a look on launch day and then go quiet. Here is how to build one screen that answers a real question and leads to action.
Lesson 5 of 6 · 6 min read ·
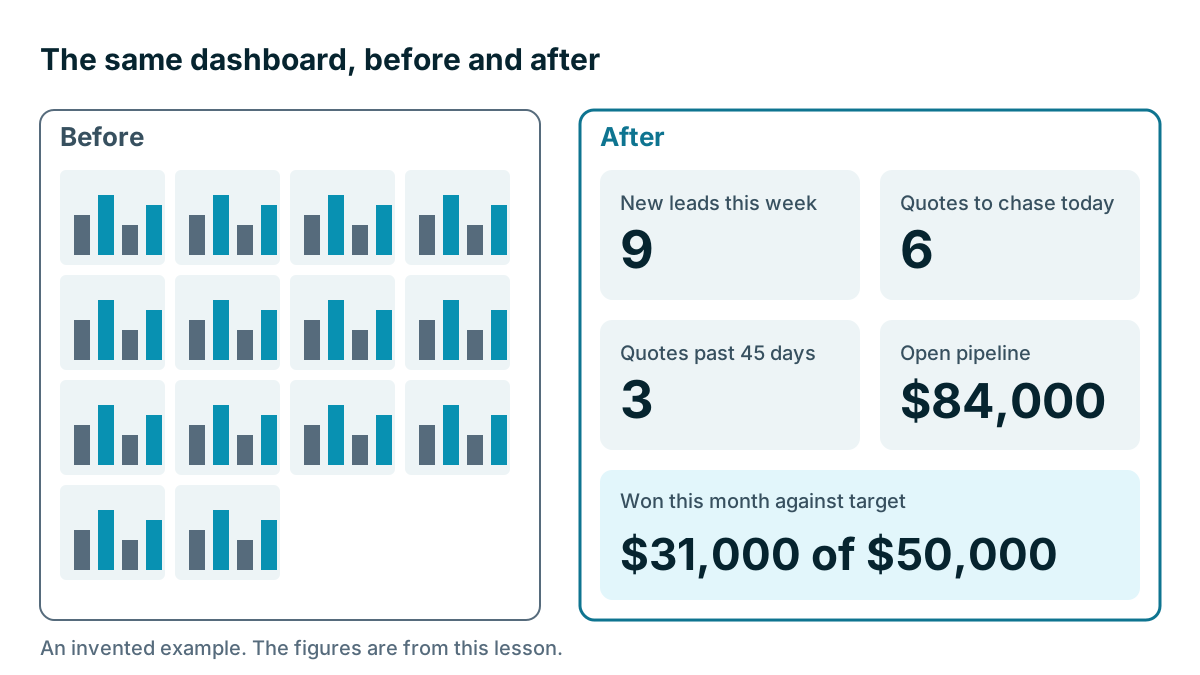
Dashboards are easy to build and hard to keep alive. Someone sets one up with 14 charts, the team admires it, and by the third week nobody opens it. That's rarely the fault of the software. A dashboard dies when it doesn't help anyone decide what to do today.
A dashboard people read follows a few plain rules.
Does your dashboard have one audience and one question?
Start by finishing this sentence: this dashboard helps [who] decide [what] every [how often].
For an invented sign shop with six staff, it might read: this dashboard helps the sales team decide who to call first every Monday.
If you can't finish the sentence, you don't need the dashboard. If you find you have two audiences, build two dashboards. An owner wants the month's money. A salesperson wants their list for today. Mixing them gives both of them clutter.
How many numbers should a dashboard show?
Six tiles is a good limit. It forces choices. If you want to add a seventh, take one away.
For each tile, ask three questions:
- What decision does this number change?
- What would make us act on it?
- Who acts?
If nobody can answer, it goes. Here is what's left at the invented sign shop after that test. These numbers are made up.
| Tile | This week | What it makes us do | Who |
|---|---|---|---|
| New leads this week | 9 | Fewer than 6, look at why | Owner |
| Quotes to chase today | 6 | Call each one | Sales |
| Quotes past 45 days | 3 | Decide: call or close | Sales |
| Open pipeline | $84,000 | Below $150,000, plan some outreach | Owner |
| Won this month against target | $31,000 of $50,000 | Check at mid-month | Owner |
Five tiles, and each one has an action. The owner can see at a glance that won sales are at 62% of target, and that open pipeline is below the line she set.
How do you know if a number is good?
A number alone doesn't tell you whether to worry. Is $84,000 good? Give every number some context, and choose one of these:
- A target: $31,000 of $50,000.
- A past period: 9 leads, against 7 last week.
- A limit: quotes past 45 days should be zero.
Showing a number in red when it falls below your line works well, as long as red is rare. If half the dashboard is red every week, people stop seeing it, or the lines are set wrong.
Choose simple forms too. A big number is often best. A bar chart compares things well. A line shows change over time. Pie charts with many slices are hard to read, and 3D effects get in the way. Keep your dates consistent, and label them, so that this month doesn't get compared with the last 30 days.
Link numbers to lists
The best dashboards have numbers that you can click. If the tile says 6 quotes to chase, one click should show those 6 quotes. That's the difference between a poster and a tool. Check this in a trial: click a chart and see whether it opens the records behind it.
If your CRM can't do that, use saved lists, or do this from a sheet with one tab per list. The list is where the work happens. The number is only a signpost.
Put it where people already are
A dashboard that requires someone to remember to open it has already lost. So bring it to them. Here are some ways:
- Make it the home screen when people log in.
- Have it emailed to the team at 7 a.m. on Monday.
- Put it on a screen in the office or the workshop.
- Open it first in the weekly meeting. This one matters the most.
If you put it on a wall, think about who walks past. Customers and visitors shouldn't be reading deal values or customer names.

How do you keep people trusting the numbers?
A dashboard is only as good as people's belief in it. One wrong number, once spotted, can lose the whole team. A few things protect that trust.
Use one definition. Use the definitions from the first lesson of this chapter, and show them in a small note if you can.
Show the date. Say when the data was last updated, especially if the numbers come from a sync.
Keep the same filters. If one tile excludes repeat work and another includes it, the two won't agree, and someone will notice.
Fix it fast. When someone says a number looks wrong, check it the same day. Go through the records behind it together. Often the number is right and the data needs fixing, and that's a useful thing to learn too.
How can you tell if your dashboard works?
A dashboard can pass a simple test. Show it to a team member for ten seconds, then ask what they would do differently today. If they can tell you, it works. If they say it looks great, it doesn't.
Then review it every quarter. Ask which tiles anyone used, and take away what they didn't. Business needs change, and dashboards should change too.
Tip
Do this on paper first. Draw the tiles on a sheet and put in numbers by hand for two weeks. If the team uses the paper version, you know what to build. It's a cheap way to avoid spending a day making something nobody wanted.
Tools
Nearly every CRM has a dashboard screen, and the differences show up in limits. Check how many dashboards each plan allows, whether you can filter by person, whether you can email them and whether charts click through to records. Coeffection, which publishes this course, has a visual report builder and dashboards over any object, including custom record types. For many small firms, that's more than they need. A simple sheet that's updated every Friday will beat a beautiful tool that nobody keeps up to date.
Key takeaways
- Decide who the dashboard is for, what they will decide and how often.
- Use six tiles or fewer, and give each one an action and an owner.
- Add context with a target, a past period or a limit, and let people click through to the records.
- Put it where people already are, keep definitions fixed and remove tiles nobody uses.
Common questions
How many numbers should a small business dashboard show?
Six tiles or fewer is a good limit. If you want to add a seventh, take one away. Each tile should change a decision.
Should one dashboard serve the whole team?
Not if you have two audiences. Build two dashboards, because mixing an owner's money view with a salesperson's daily list gives both of them clutter.
How do I know if my dashboard is working?
Show it to a team member for ten seconds, then ask what they would do differently today. If they can tell you, it works.
Keep your place and test yourself
Enroll for free to save your progress, take the chapter quiz, and get a certificate when you pass every chapter. The lessons stay open to everyone either way.