

Chapter 4: Pipelines and Sales Funnels
Forecasting Honestly From Your Pipeline
A forecast is only an educated guess, but it can be an honest one. Here is how to weight your pipeline using your own history, and when to ignore the sum.
Lesson 5 of 6 · 7 min read ·
Add up the deals on your pipeline and you get a big, pleasant number. It isn't what you will earn. Every owner knows this, and then quietly plans around it anyway, hiring someone or buying a van on the strength of it.
A forecast is an estimate of the money likely to come in over a period. It will never be exact. The goal is to be roughly right, and honest about how sure you are, so you can decide whether to order materials, take on help or start looking for more work.
How do you weight a pipeline?
Weighting a pipeline is simple. Each stage gets a percentage, based on how often deals at that stage end up won. Multiply each deal's value by that percentage, and add them up.
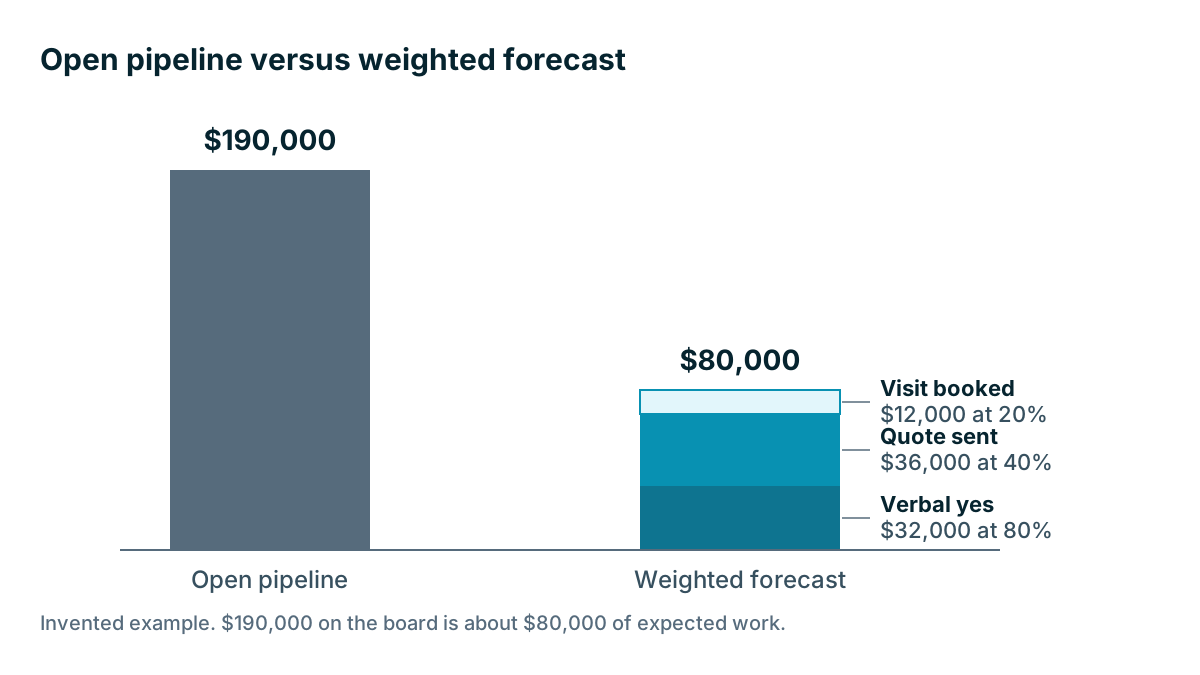
Here is an invented example. A roofer has $190,000 of open deals on his board.
| Stage | Open value | Chance of winning | Weighted value |
|---|---|---|---|
| Visit booked | $60,000 | 20% | $12,000 |
| Quote sent | $90,000 | 40% | $36,000 |
| Verbal yes | $40,000 | 80% | $32,000 |
| Total | $190,000 | $80,000 |
So $190,000 on the board is really about $80,000 of expected work. That's a less exciting figure, and a far more useful one.
Where should your win percentages come from?
The default percentages in a CRM are somebody else's guess. Work out your own. Take your deals from the past year and count, for each stage, how many reached it and how many of those were eventually won.
If 40 of the roofer's deals reached Quote sent and 16 were won, then that stage is worth 40%. It takes an hour with a spreadsheet, and it's worth doing once a year.
If you are new and have no history, start with low guesses, and replace them once you have 20 or 30 finished deals. It's better to be pleasantly surprised. Be aware that a stage percentage only means something if your stages are real. If Verbal yes means the rep felt good, then 80% is a fantasy. That's why the lesson on exit tests came first.
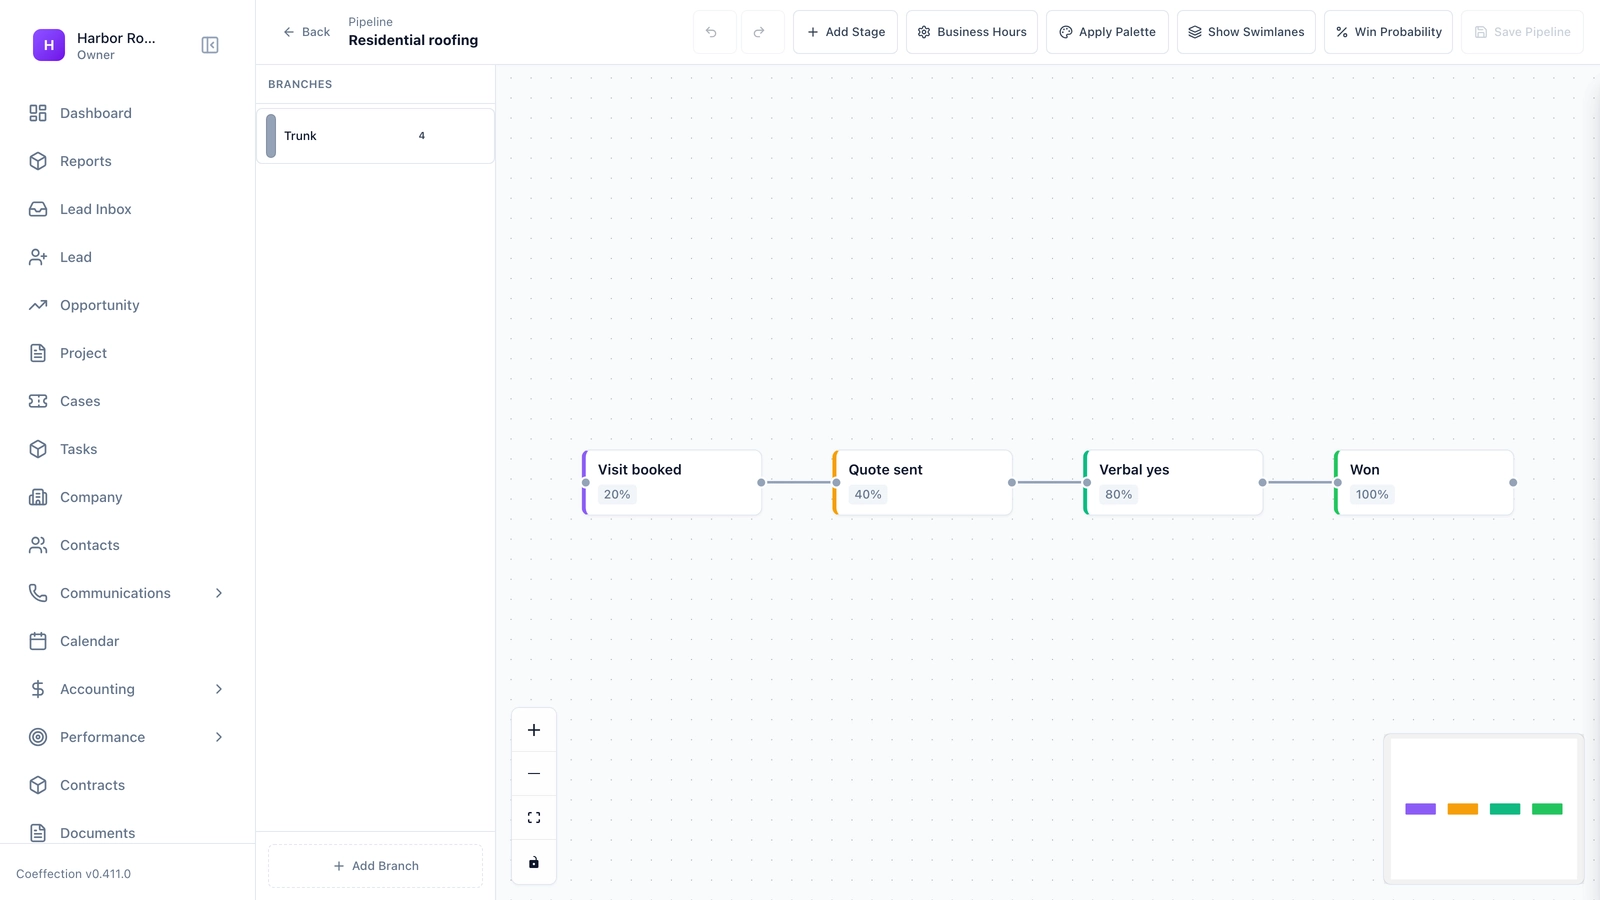
Many CRMs will do this sum for you if you set a percentage on each stage. Some let you override it on one deal, which is useful when you have a good reason.
When does a weighted total mislead you?
Weighting works when you have a lot of deals of similar size, because the wins and losses even out. A small business often doesn't have that.
Suppose a two-person agency has one $50,000 proposal at 40%. The weighted value is $20,000. But that deal will never bring in $20,000. It will bring in $50,000 or nothing. If you have three or four large deals, don't rely on a weighted total. Name the deals and plan for both outcomes: what happens if we win this one, and what happens if we don't?
You should also check timing. The roofer's $80,000 won't all land next month. Every deal needs an expected close date, and your forecast should count only the deals closing in the period you care about.
Three numbers, not one
A clearer approach for a small business is to sort each month's deals into three groups:
- Committed: signed, or as good as signed. You would bet your own money on these.
- Likely: past the point of real interest, with a date and a next step. These might go either way.
- Possible: real, but early. Don't plan around these.
Now you have a floor, a likely range and an upside. A plain statement like, $30,000 is committed, up to $55,000 is likely, and anything above that is a bonus, says more than one precise figure could. A bakery wholesaler with standing orders can treat those as Committed, and put new cafes under Possible. It's also easy for a non-numbers person to explain to a bank or a partner.
Example
An invented example. A roofer plans next month's crew. Committed is $42,000 of signed jobs, which covers about two and a half weeks of work. Likely adds $20,000 more. He books his crew for three weeks and holds off on a temporary hire until one of the likely jobs signs. He made that decision from three numbers on one page.
Keep the dates honest
Most bad forecasts share one symptom: expected close dates that keep moving. A deal due to close in March slips to April, then May. Each push looks reasonable on its own, and the forecast never shrinks.
Set some simple rules:
- A deal with an expected close date in the past gets a new date, with a reason, or it gets closed.
- A deal that has slipped twice drops one group, from Likely to Possible.
- A deal with no activity in your time limit doesn't count in the forecast.
- Nobody moves a date to tidy the report at the end of the month.
Watch out for who is doing the guessing, too. Salespeople tend to be hopeful, which is partly why they are good at the job. A new salesperson may also think a friendly call means a sale. So when a deal moves to Verbal yes or Committed, ask one plain question: what did the customer say or do that puts it there? If the answer is a feeling, it stays where it was.
How do you check how accurate your forecast is?
Comparing your forecast with what really came in is the step almost nobody takes, and it's the one that makes forecasting improve. At the start of each month, write down your Committed and Likely numbers. At the end of the month, compare them with what really came in.
If you keep landing well below Likely, you are optimistic, and your percentages or your stages need work. If you keep beating it, you are being cautious, which is safer, though it may mean you are turning down work you could have handled. After six months, you'll have a good sense of how far to trust yourself.
Watch out
A pipeline forecast estimates sales, not cash. A won job may not pay out for weeks or months. Don't use it to judge whether you can make payroll. For that, use a cash flow view from your accounting software or your bookkeeper.
If you only have a handful of deals, a forecast may be overkill. Listing them on a page, with a yes, no or maybe beside each, gets you most of the value.
Key takeaways
- Multiply each open deal by the chance of winning from that stage, and use your own history for the percentages.
- A weighted total works when you have many similar deals. For a few big ones, name them and plan both outcomes.
- Committed, Likely and Possible are often clearer than a single number.
- Treat slipping close dates as a warning, and write down rules for them.
- Compare your forecast with what really happened each month. Remember that sales are not cash.
Common questions
How do I calculate a weighted sales forecast?
Multiply each open deal's value by the win chance for its stage, then add up the results. The stage percentages should come from how often deals at that stage were won in your own history.
Is a sales forecast the same as cash in the bank?
No. A forecast estimates sales, not cash, and a won job may not pay out for weeks or months. Use a cash flow view from your accounting software or your bookkeeper to judge whether you can make payroll.
Should a small business with few deals forecast at all?
A forecast may be overkill when you have only a handful of deals. Listing them on a page, with a yes, no or maybe beside each, gets you most of the value.
Keep your place and test yourself
Enroll for free to save your progress, take the chapter quiz, and get a certificate when you pass every chapter. The lessons stay open to everyone either way.