
Build Your First Report
9 min read · Beginner · Reporting
Every number you see on a dashboard started life as a report: a saved query against your CRM data with its own columns, filters, and chart type. You don't need to write SQL or know your schema. The report builder lets you point at an entity, drag in the fields you care about, and see results update as you go. In this guide you'll build one report from scratch and pin it to a dashboard so your team sees it every time they log in.
Open Reports and start a new report
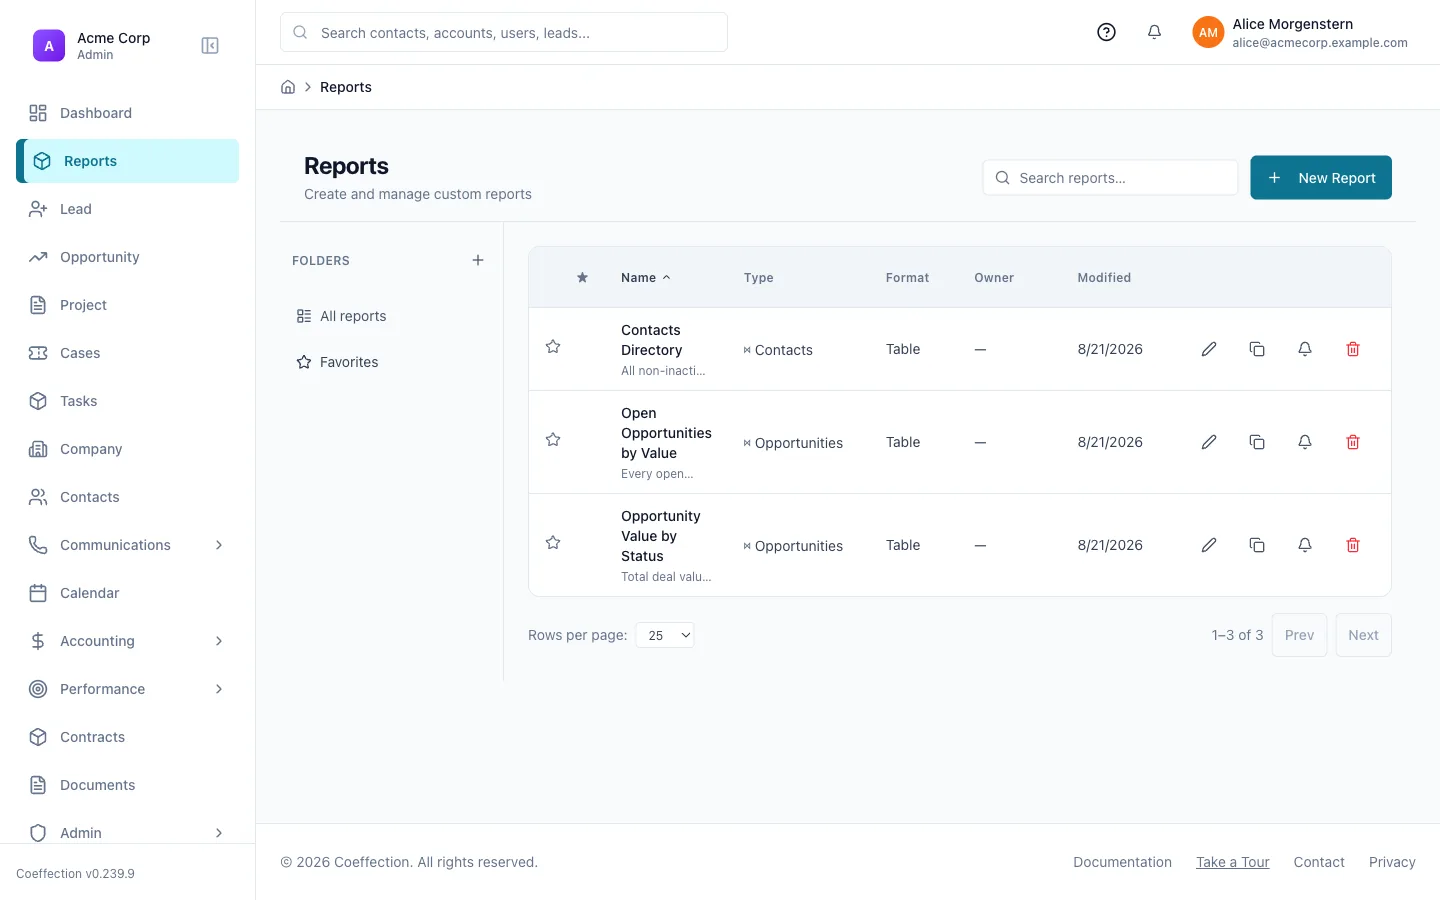
Head to Reports in the sidebar. This is your workspace's report library: a standard set of pre-built reports covering common sales, support, and financial metrics, plus anything your team has already saved. Click New Report to start one from scratch.
Pick the entity you want to report on
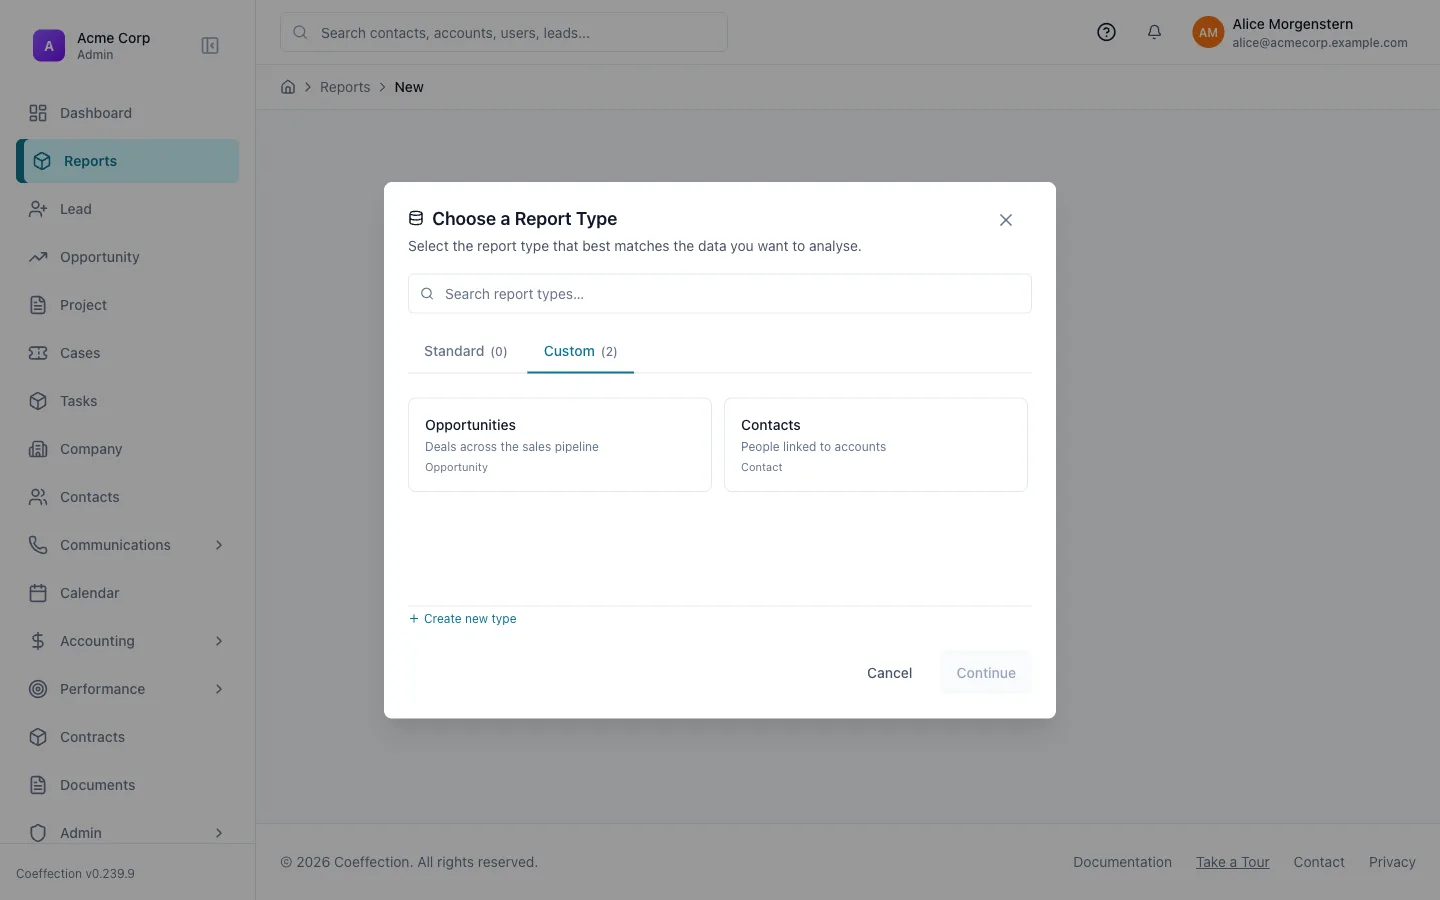
You'll be asked to choose a report type: what the report is built on. Pick the entity that holds the data you're after, like Opportunities, Contacts, Accounts, Tasks, or a custom entity your team has defined. Some report types already join two related entities together, which is handy when you want fields from both sides of a relationship (for example, an opportunity's stage alongside its account name) on the same row.
Choose your columns and measures
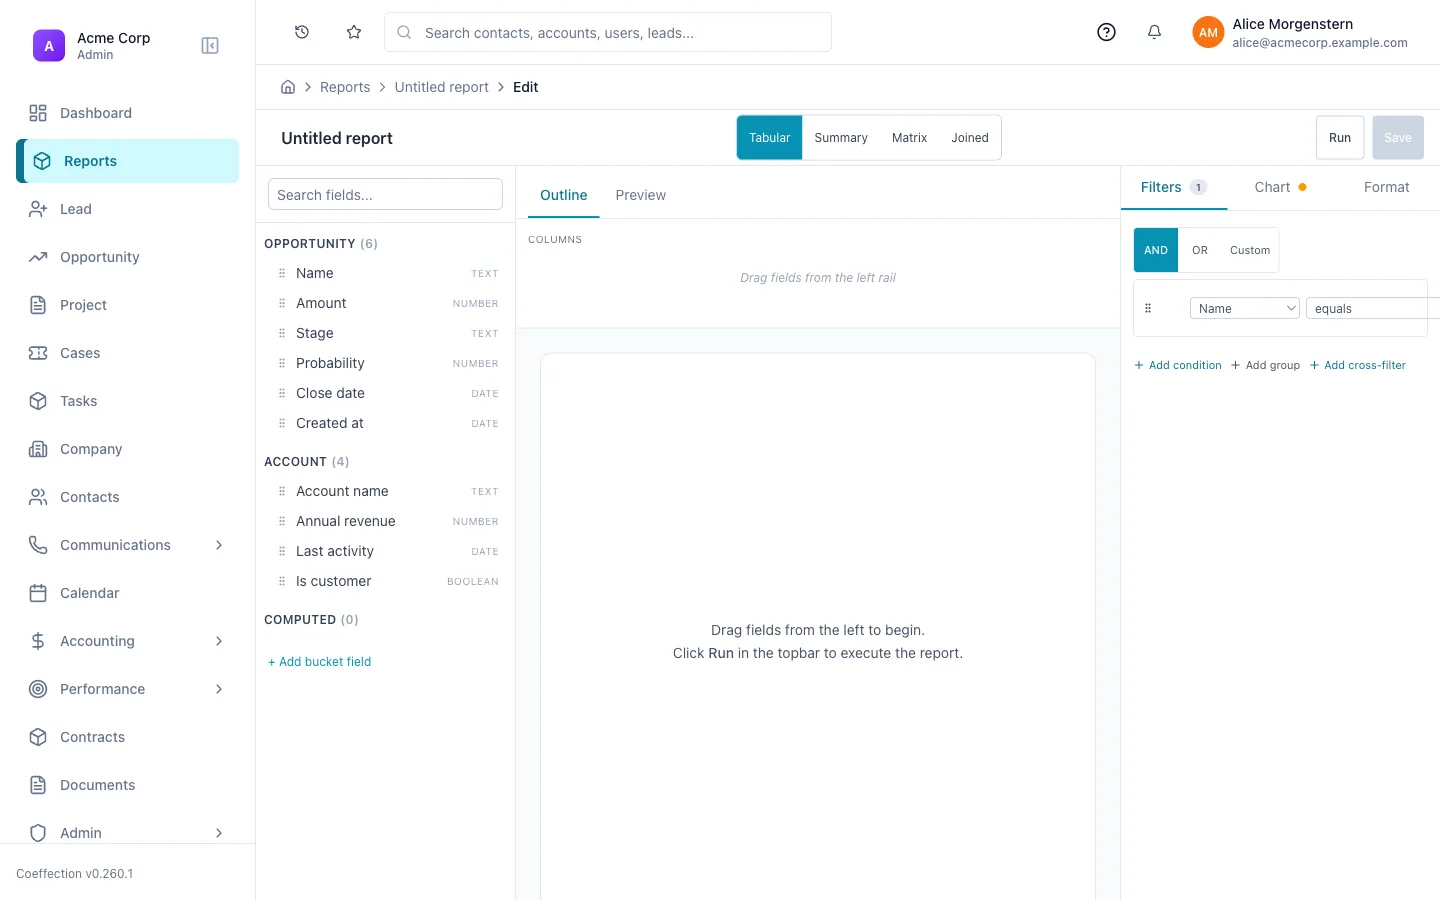
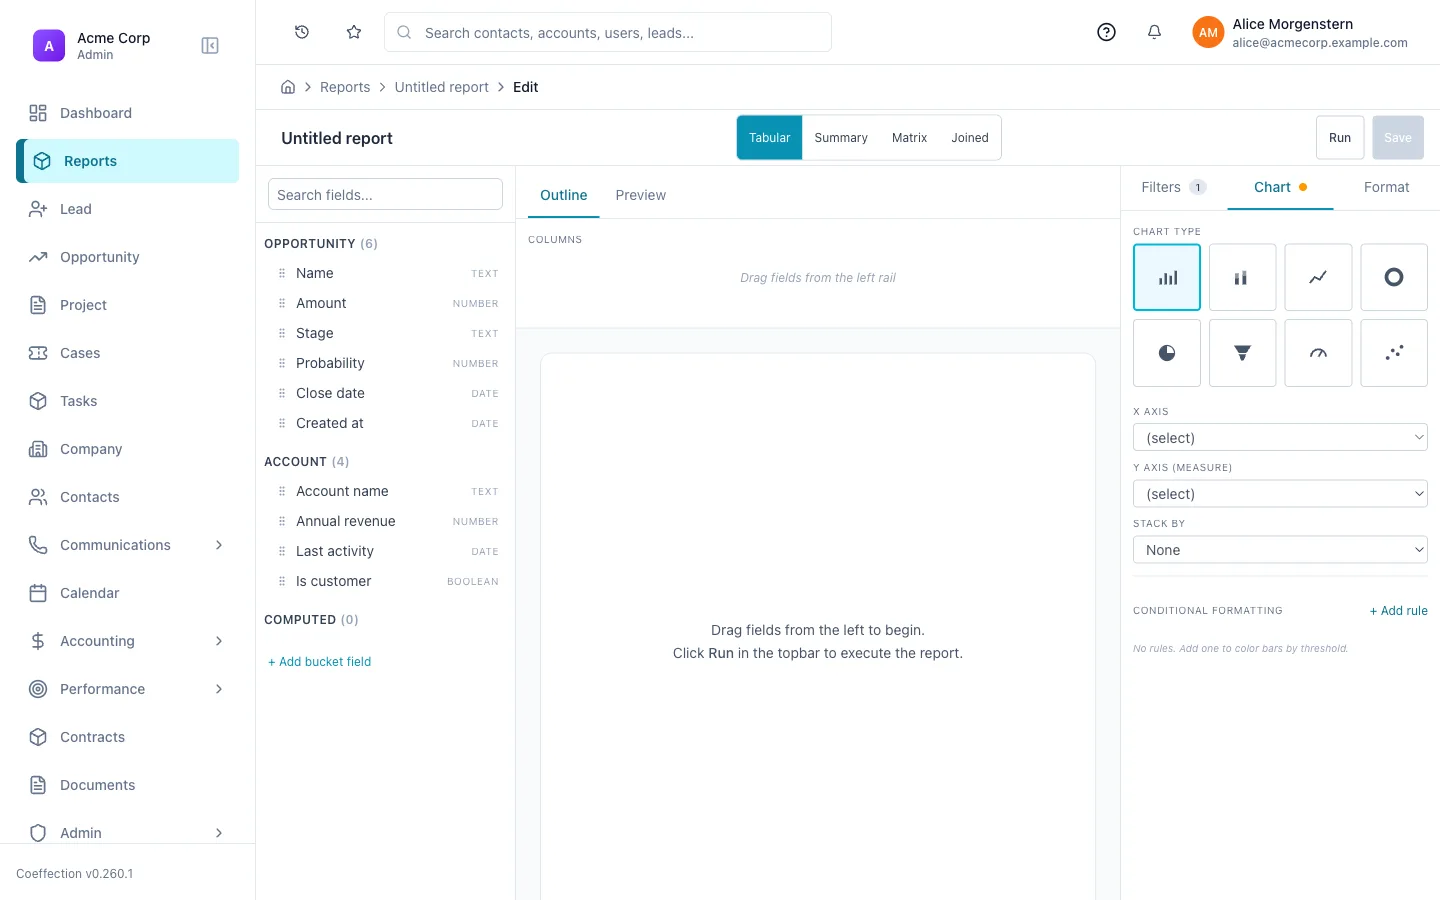
Once you're in the builder, you'll see the available fields for that entity on one side and a live preview of your report on the other. Drag the fields you want into the report as columns: text and date fields work well as columns, while numeric fields (like deal amount) can also be used as measures to total, average, or count.
Start with a handful of fields
It's tempting to add every field at once. Start with three or four that answer the question you actually have. You can always drag more in later, and a narrower report is easier to read at a glance.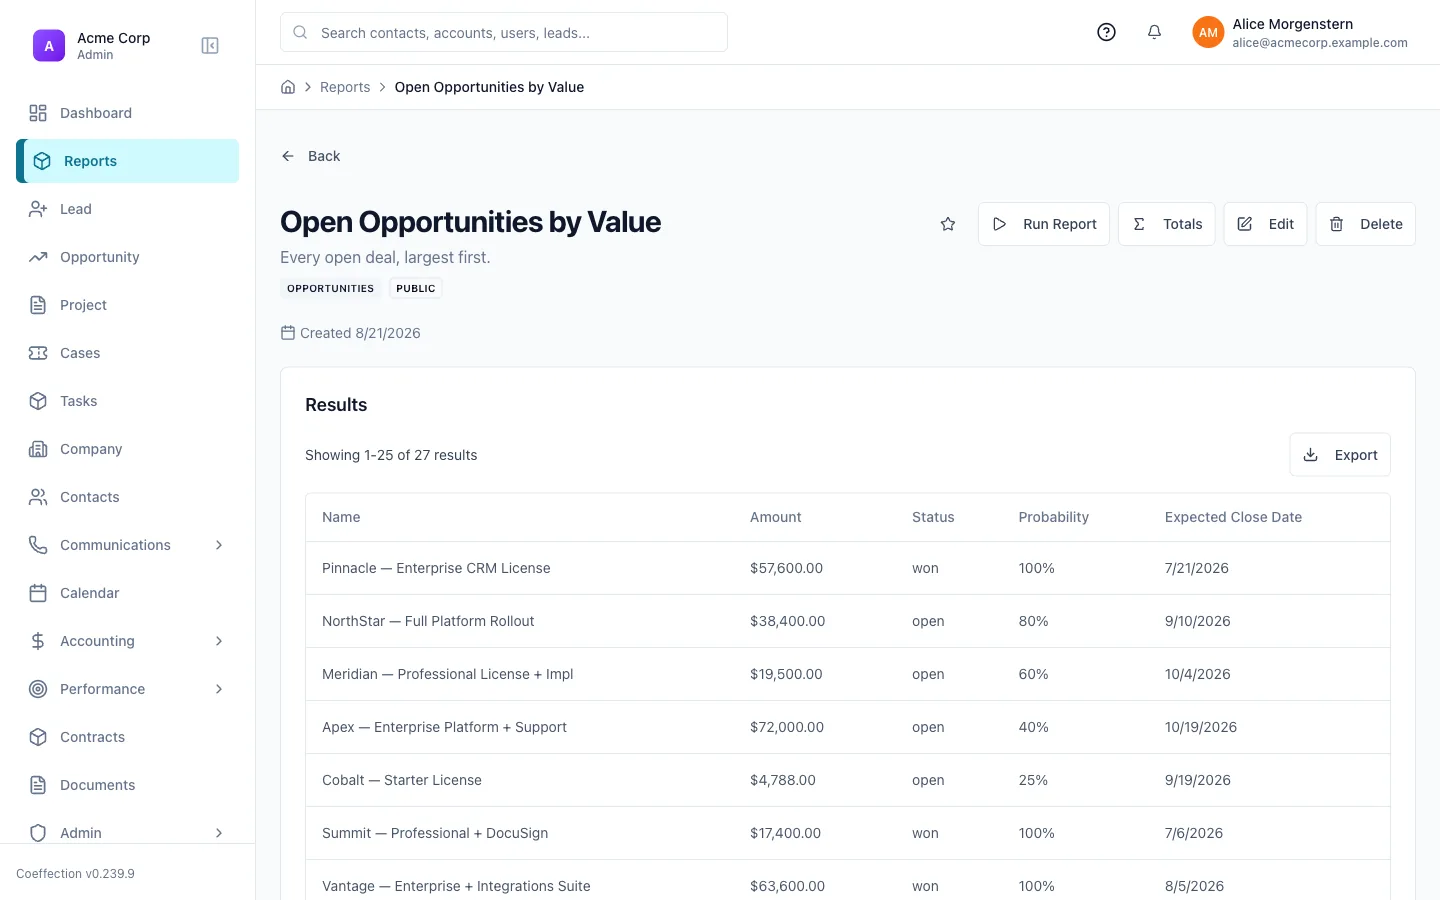
Add a filter to narrow the results
Switch to the Filters panel and add a condition to scope the report down to what matters, something like Stage = Closed Won or Close Date = This Quarter. You can stack multiple conditions together, and the preview updates as soon as you add one so you can see exactly which records made the cut.
Group your data or add a chart
If you want totals broken out by category (deals grouped by rep, or tasks grouped by status), use the grouping options to bucket rows or columns by a field. If you'd rather see the numbers visually, switch to the Chart panel and pick a visualization type: bar, line, pie, donut, funnel, and a few others are all available, each with its own axis and grouping options.
Save the report
Give the report a clear name and save it. It'll now show up in your Reports library any time you want to reopen or edit it.
Reports are private by default
A report you save is only visible to you until you explicitly share it. Look for the share option to make it visible to specific roles or your whole workspace once you're happy with it.🖼 Screenshot coming soon
Pin the report to a dashboard
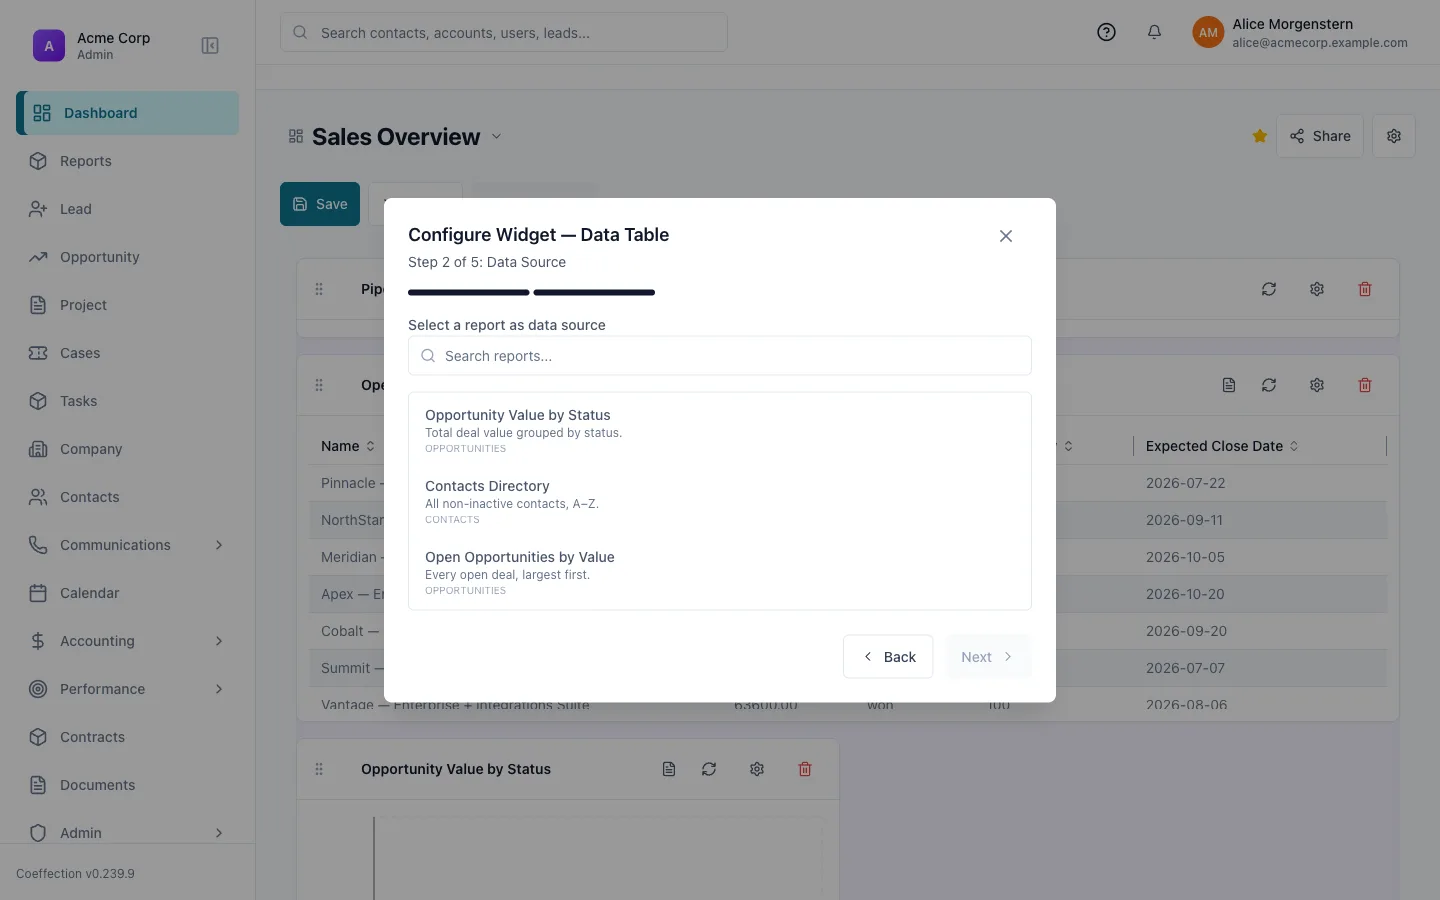
Open the dashboard you want it on (or create a new one), and add a widget. Choose a widget type that's backed by a report, like a chart or table widget, then pick the report you just saved from the list. Save the dashboard layout, and the report's results will now render right there for anyone who has access to that dashboard, refreshing automatically as the underlying data changes.
With one report pinned to a dashboard, you've built the whole loop, from picking your data to seeing it update automatically for your team. The next guide, Dashboard Widgets, covers the other widget types available beyond reports and how to request a custom one.