
Forecasting: Recurring Revenue by SKU
8 min read · Intermediate · Reporting
A regular opportunity carries a single amount and a close date. But a lot of revenue isn't one-and-done: a retailer buys the same products from you every week through a season, a customer renews the same subscription every month. Forecastingmodels that recurring revenue the way it actually behaves — product by product, period by period — instead of squashing it into one number.
You turn it on for one entity type (a Contract works well), lay out a grid of planned quantities per SKU per period, and Coeffection prices it out into revenue, tracks plan against actuals as the season plays out, fires a production signal when the deal goes live, and reports on all of it. This guide walks the whole path using a seasonal supplier as the example.
Turn on Forecasting for an entity type
Open Admin → Entity Types, pick the type you want to forecast (a Contract is the natural home), and switch to its Forecasttab. Enable forecasting, then map each of that type's pipeline stages to either pending (still being negotiated) or live (in production). That mapping is what tells Coeffection when a forecast has actually started.
The stage map drives the go-live signal
The production signal in step 5 fires the moment a record crosses from a pending stage into a liveone. Map your stages carefully here, because that boundary is the trigger — nothing downstream happens until a record steps across it.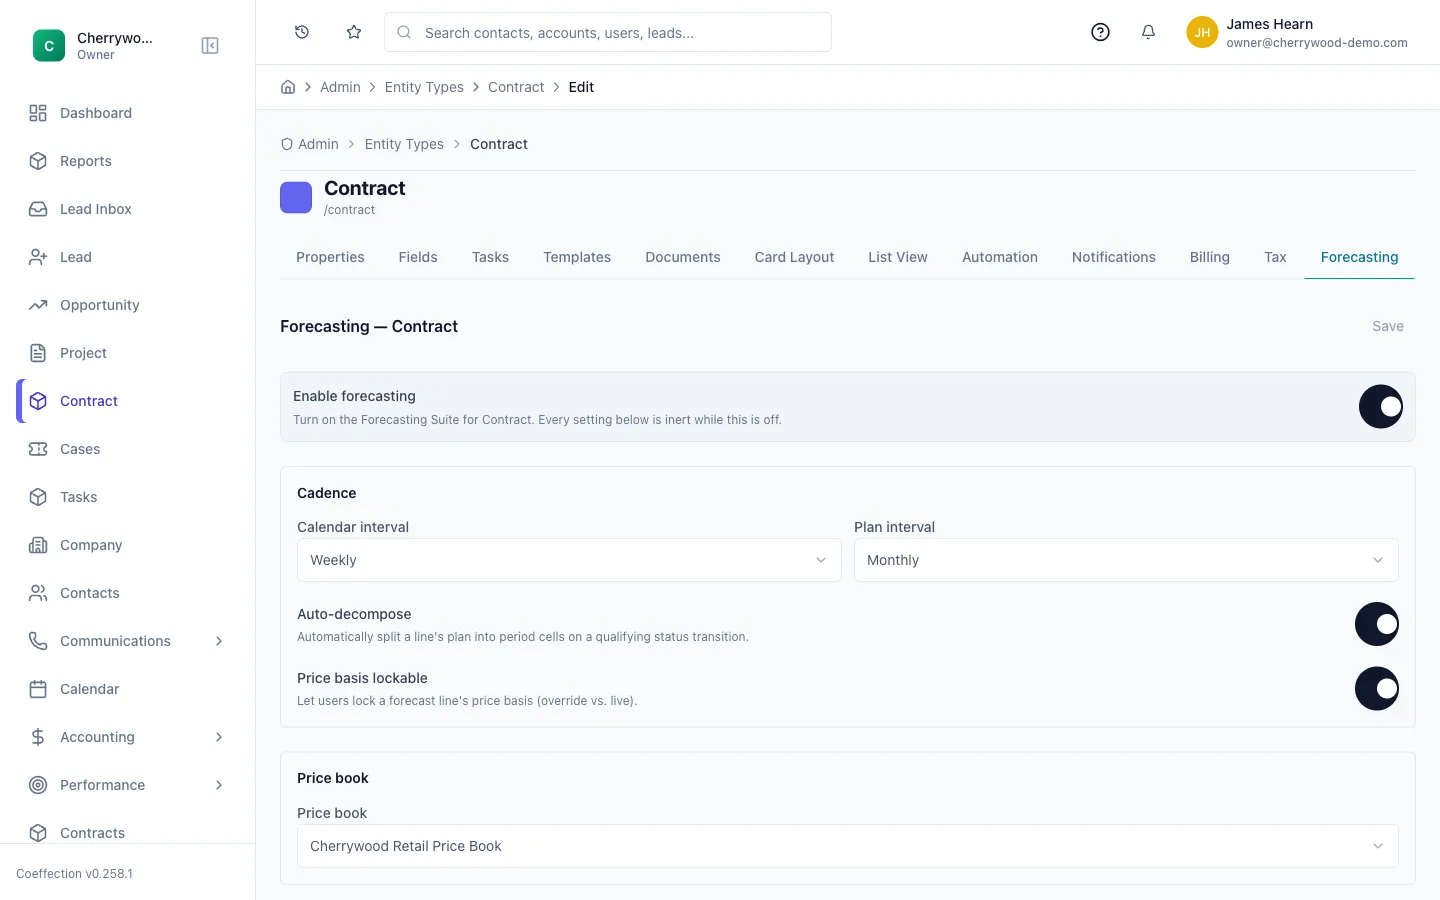
Add SKU line items to a record
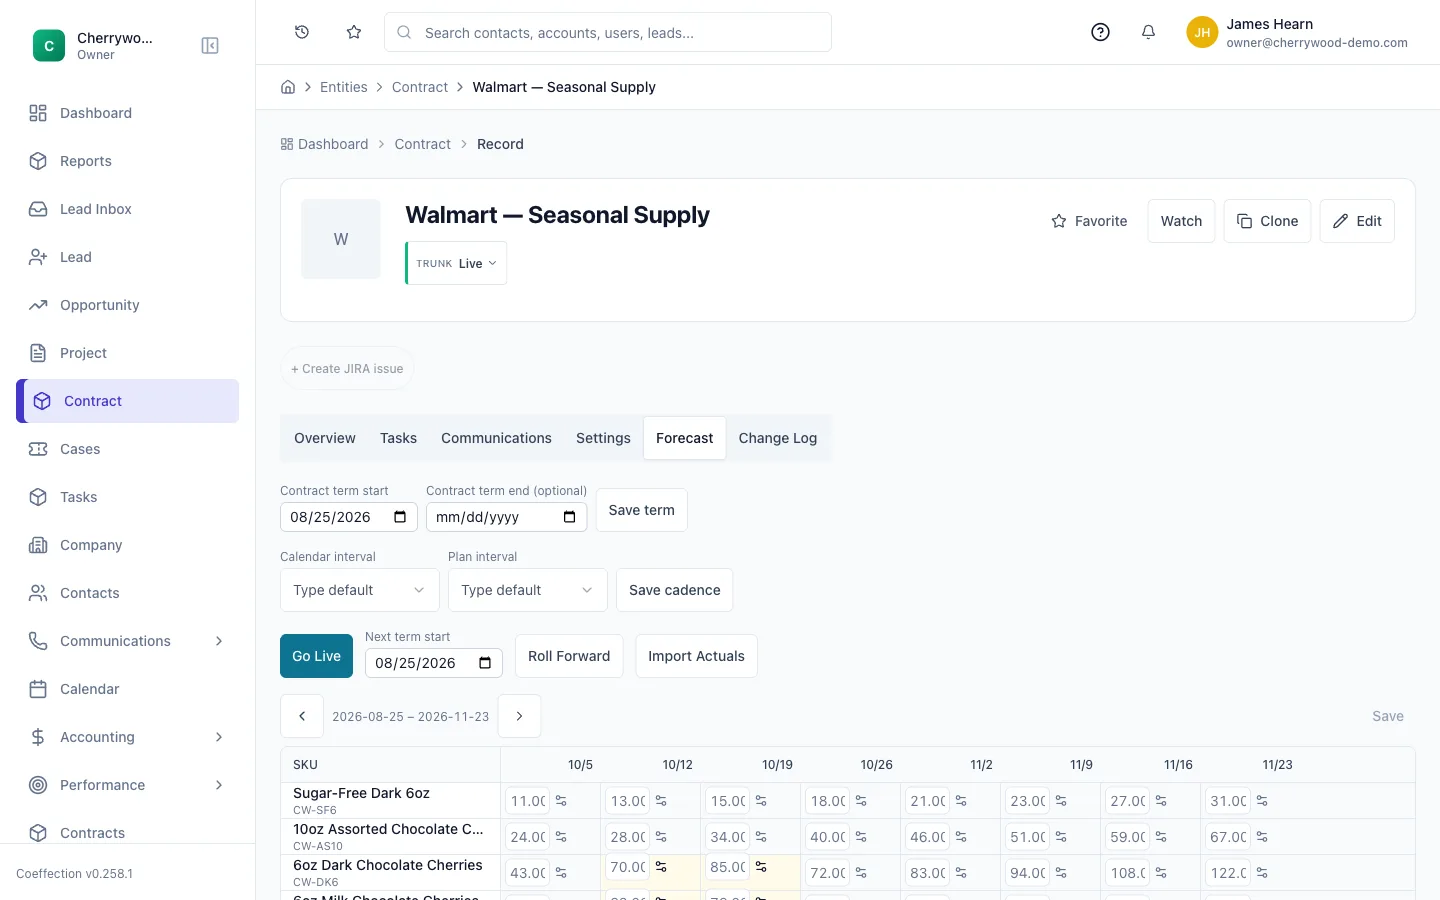
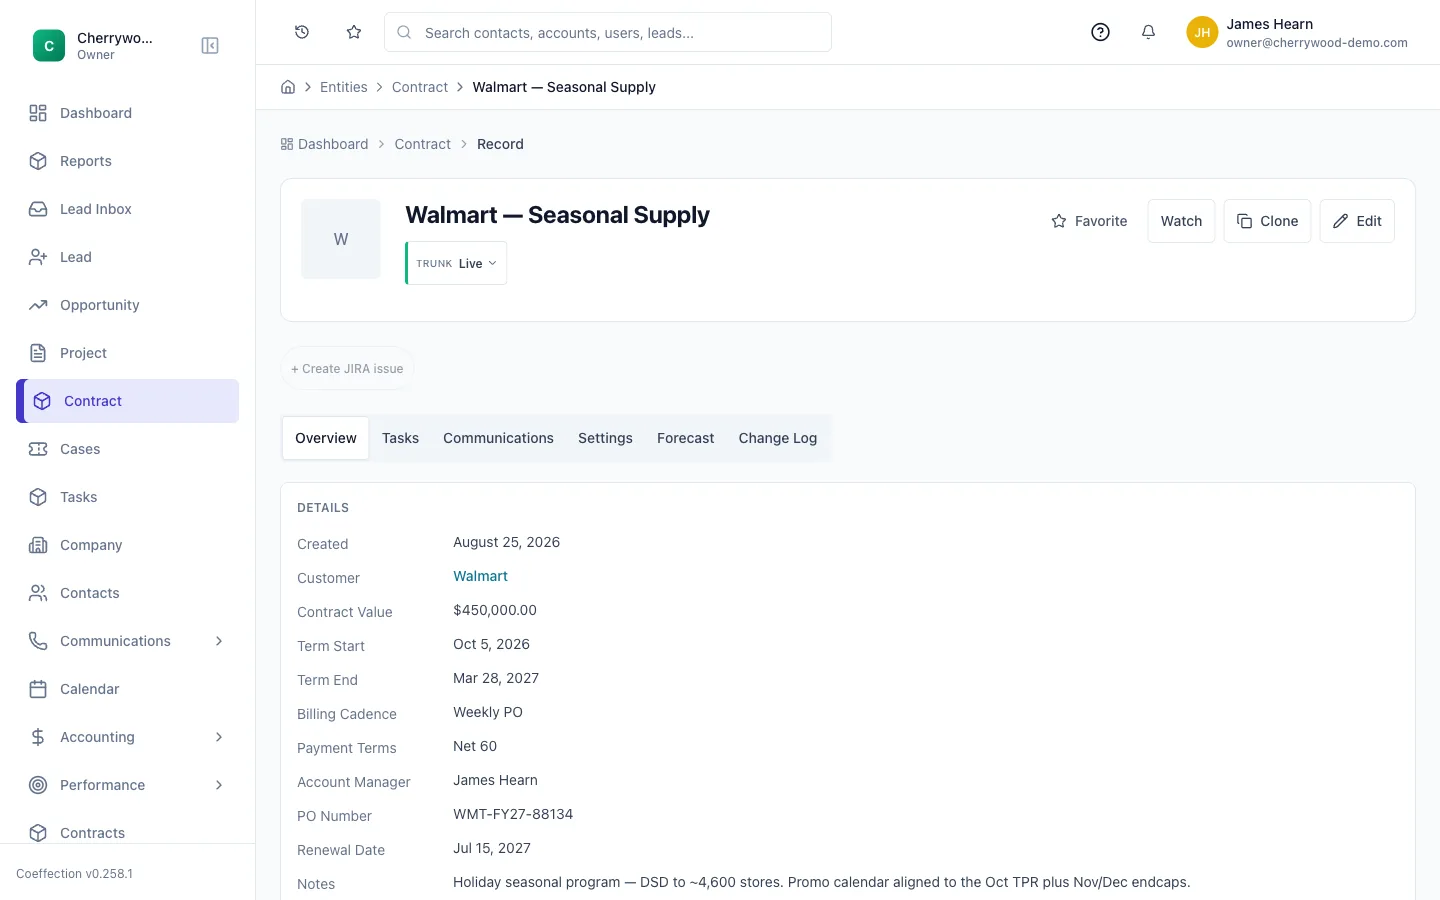
Open a record of that type and go to its Forecasttab. Add the products you'll be selling on repeat as line items— each SKU becomes a row in the forecast. The price comes straight from your price book, so a SKU that sells for $24 a case is priced at $24 everywhere it shows up without you re-typing it.
Fill in the forecast grid
The grid is SKUs down the side and time periods across the top. Set the cadence (weekly or monthly) and the contract termto control which period columns appear, then type a planned quantity into each cell. Coeffection multiplies quantity by the SKU's price on the fly, so revenue totals build up as you fill the grid in.
Let the shape of the season do the work
You don't have to enter every week by hand. Rough in the peak weeks and the quiet weeks, and lean on the totals at the edge of the grid to sanity-check the season before you commit to it.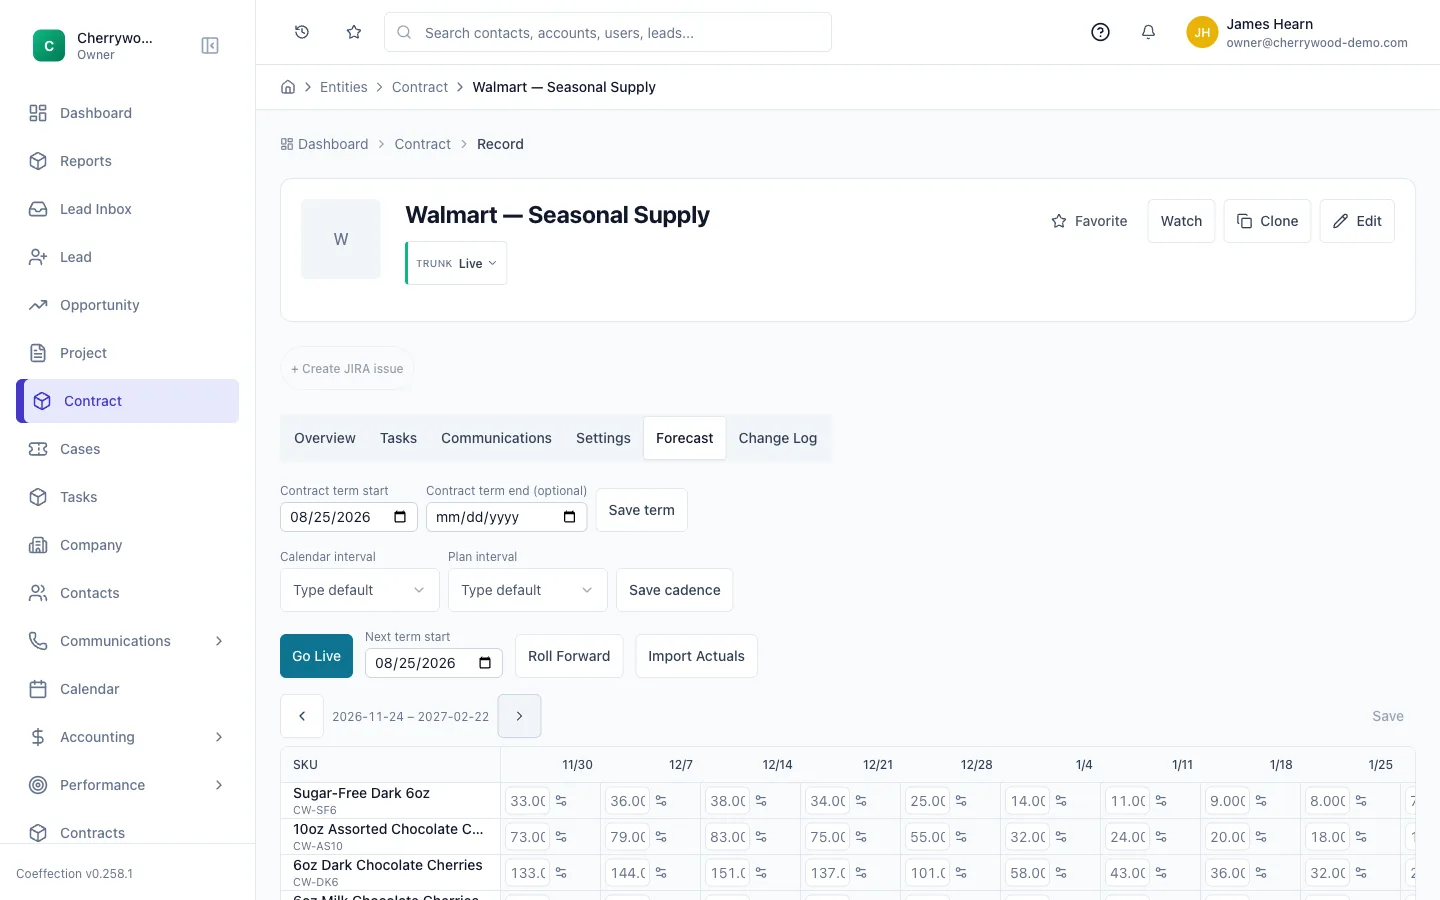
Flag promotions and overrides
Real seasons aren't flat. Mark a period as a promo (a temporary feature or price cut) and it's highlighted in the grid and tracked separately as promo revenue, so you can see how much of the plan is riding on discounts. And any time you type a number over the computed one, that cell is badged as an override.
Overrides survive a recompute
A badged override is a number you meant. If you later roll the forecast forward or bulk-recompute the grid, overridden cells are left exactly as you set them — your hand-tuned weeks never get quietly overwritten.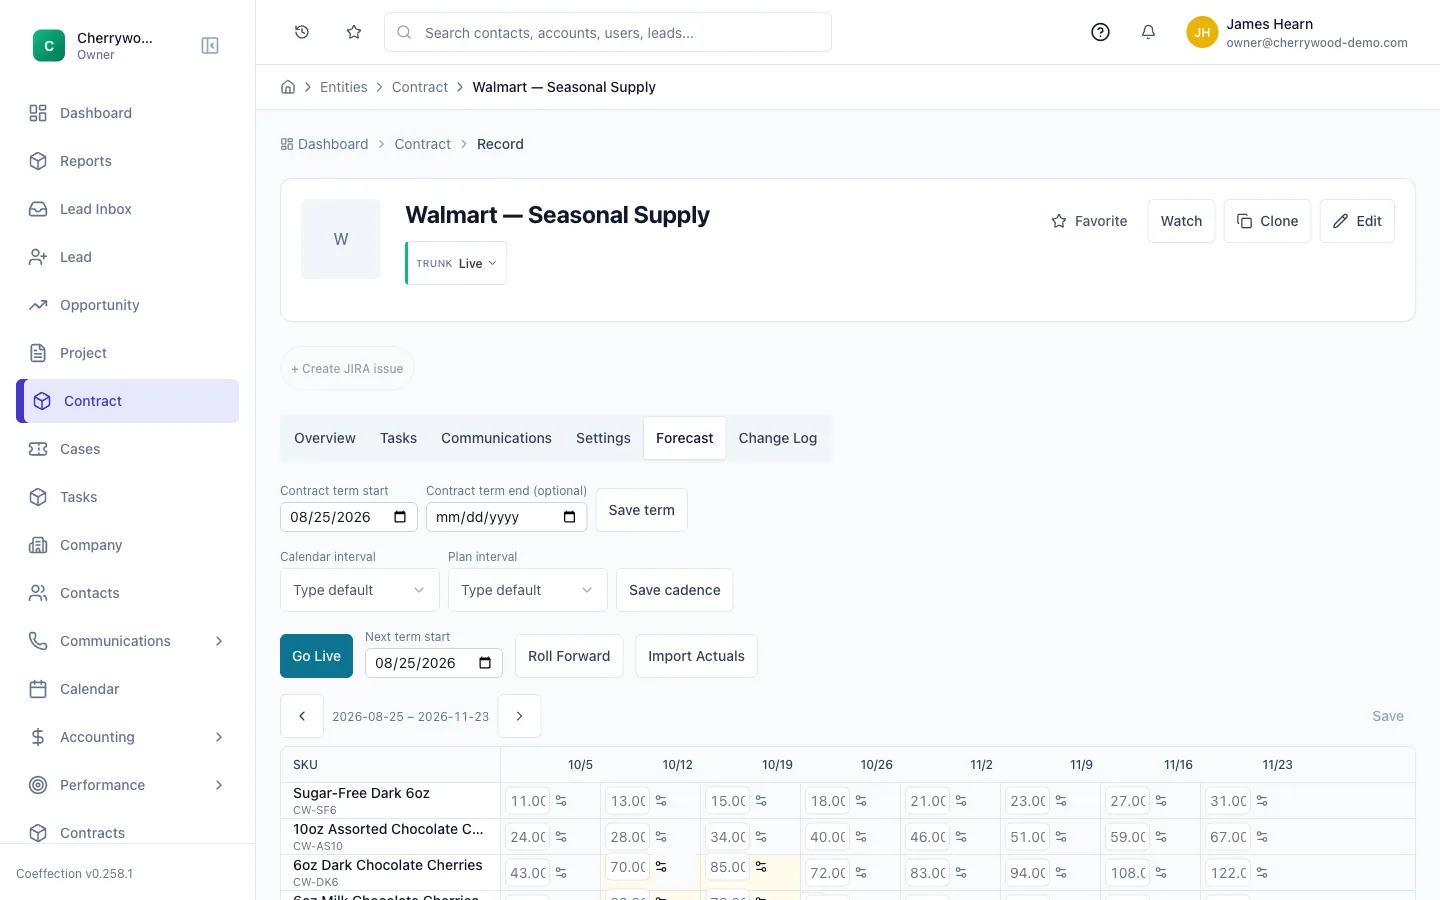
Take it live
When the deal is signed and headed into production, move the record into a live stage. Crossing that boundary emits a production signal— a snapshot of the whole forecast, by SKU and period. Everyone watching the record gets an in-app notification, and if you've configured an outbound webhook, the same snapshot is posted to your planning or ERP system so it can start producing to the plan.
Report and dashboard on the forecast
Everything in the grid flows into the report builder. Build a report on the forecast source — revenue by customer, plan vs actual by SKU, a weekly revenue trend — and pin them to a dashboard for an at-a-glance read on where the season is landing. As real numbers come in, the same reports show plan against actual so you can see who's running ahead and who's behind.
Cost and margin are permission-gated
Revenue reporting is open to anyone who can view the forecast. Cost and margin columns are separate: they only appear for people who hold the view-cost permission, so you can share a revenue dashboard widely without exposing your COGS.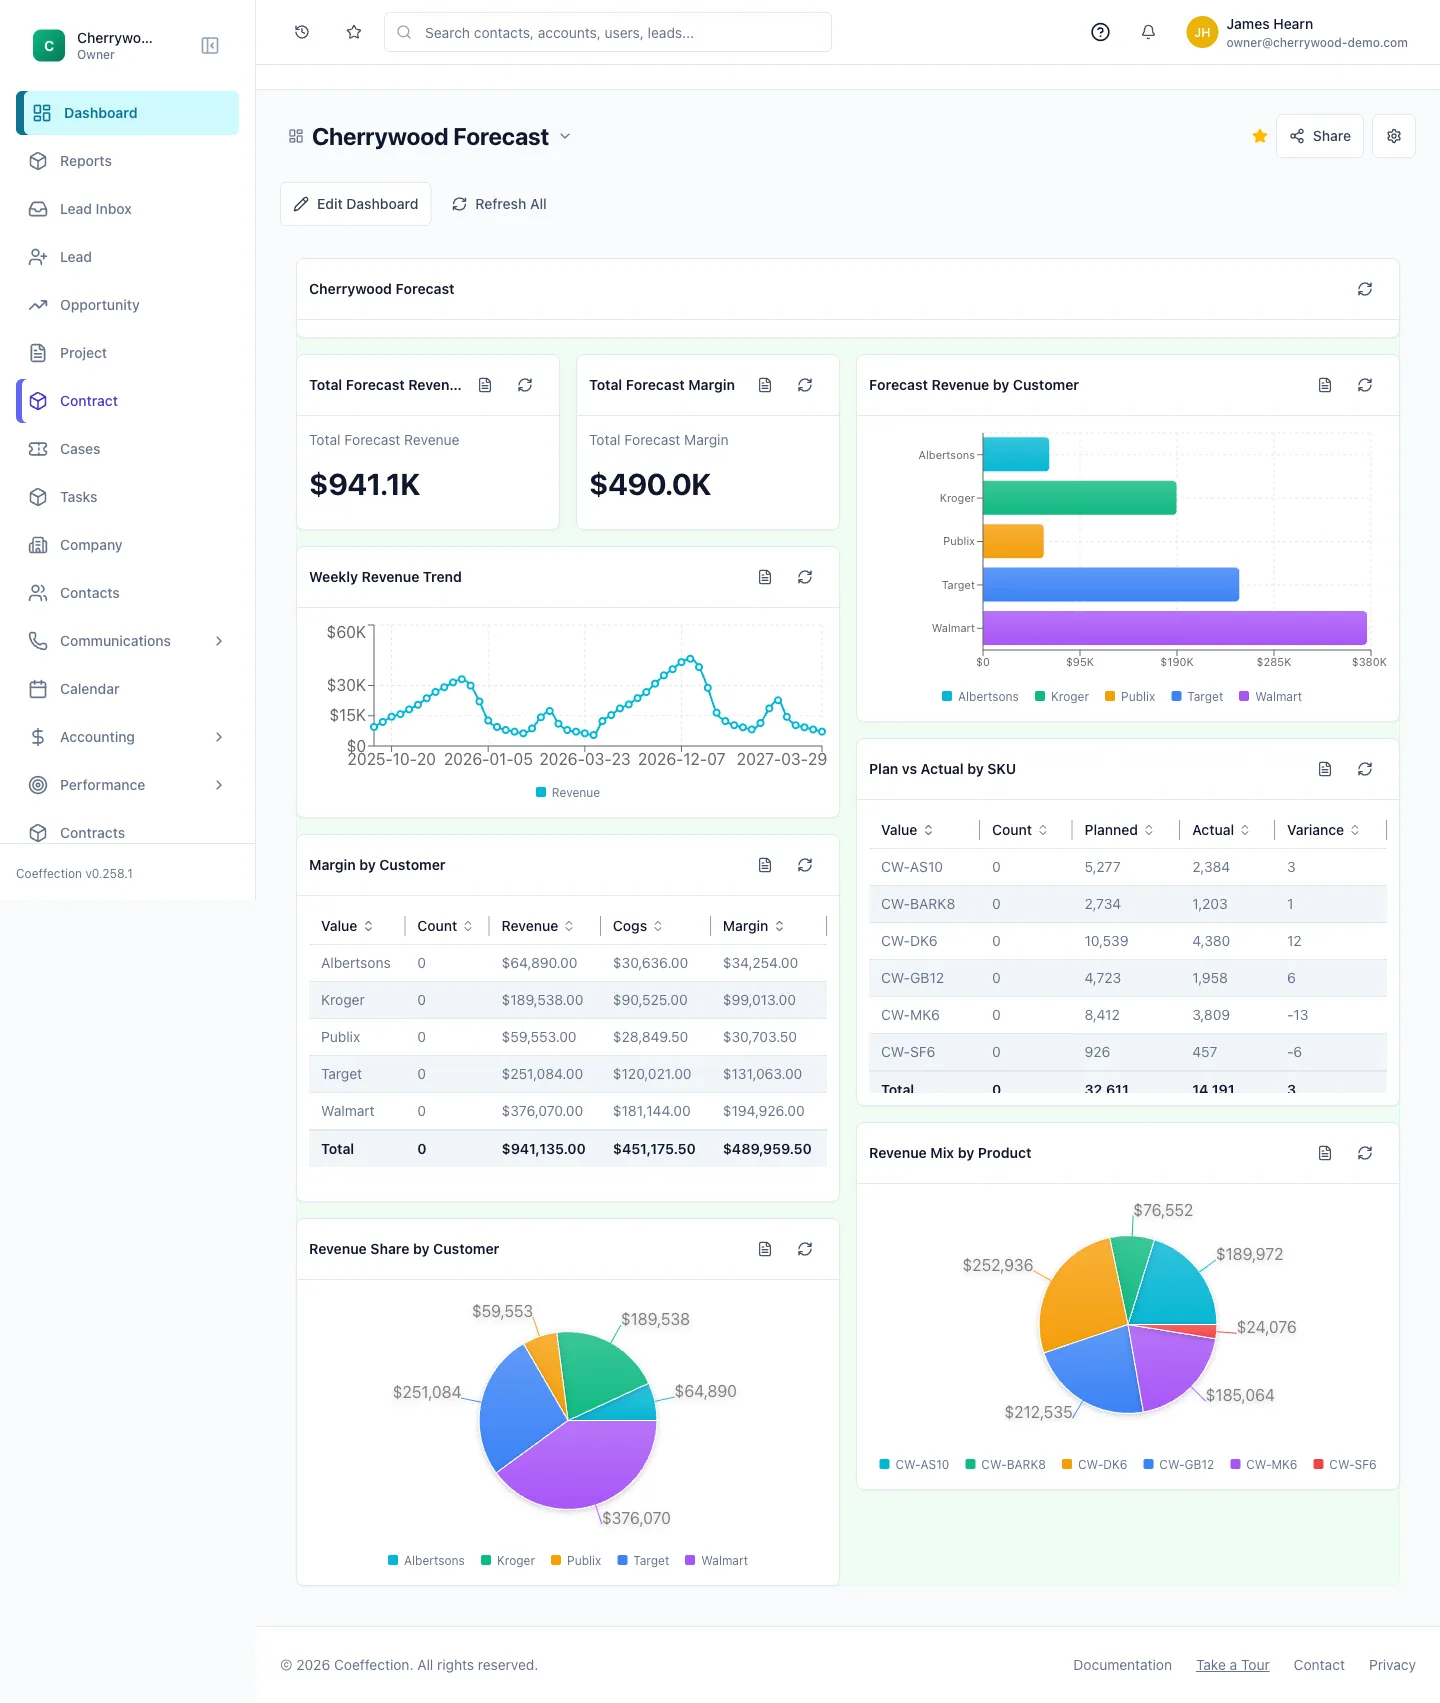
That's the full loop — from a stage map to a live production signal to a dashboard. If you want to go deeper on the reporting side, the Dashboard Widgets guide covers every widget type you can point at these forecast reports.