
- dashboards
- reporting
- product-updates
The dashboard you actually check every morning
This spring we rebuilt the report builder, made dashboards something you assemble from your own reports instead of inherit, added precise team and role sharing, and rebuilt global search, so the number you check every morning finally lives in the CRM instead of a spreadsheet you rebuild by hand.

Open your CRM first thing in the morning and look at what it shows you. Odds are it is a dashboard someone at the vendor designed, full of tidy gauges that answer questions you never asked and stay silent about the one number your day actually turns on. So you do what everyone does. You close it, open a spreadsheet, and rebuild the view you needed by hand. The real morning ritual is export, paste, refresh.
We wanted to kill that ritual. Not by guessing which four charts you want, but by handing you the tools to say it yourself.
So this stretch we rebuilt the thing underneath all of it: the report builder.
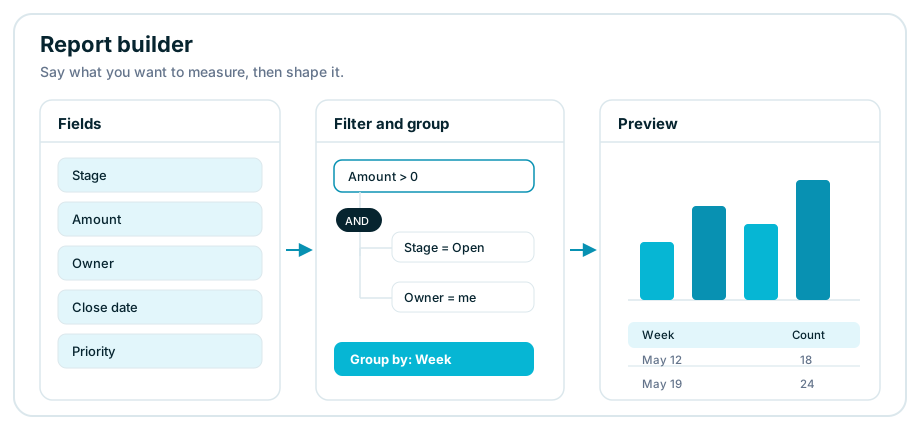
You start by saying what you want to measure. Pick a report type, Opportunities or Tasks or one of your own custom types, then drag the fields you care about into place. Build the filter as a real tree, with nested and-or groups, conditions that reach across related records, and "with" or "without" logic when you need it. Group the results, bucket them by day or week or month, add a formula column that does the math for you. Pick from four report shapes and eight chart types. And when it is right, schedule it to land in your inbox as a PDF or a spreadsheet on whatever cadence you keep. That is the raw material. One clear answer to one clear question.
But a morning is not one question. It is a dozen at once, and nobody wants to open a dozen reports to start the day.
The board that's actually yours
So the reports needed a home, and over these weeks that home grew up. A dashboard in Coeffection is now something you assemble. Drag widgets where you want them, resize them, and group the related ones into colored sections with their own headings. A metric card shows the number and whether it moved since last week, up, down, or holding flat, so you read the trend without doing arithmetic. A table turns raw data into something you can scan: a due date that has slipped goes red, a status becomes a pill, the assignee becomes their face, a priority becomes a small colored dot. Leaderboards run off a real report instead of a frozen list, and roll up an "Unassigned" row when the grouping comes back empty.
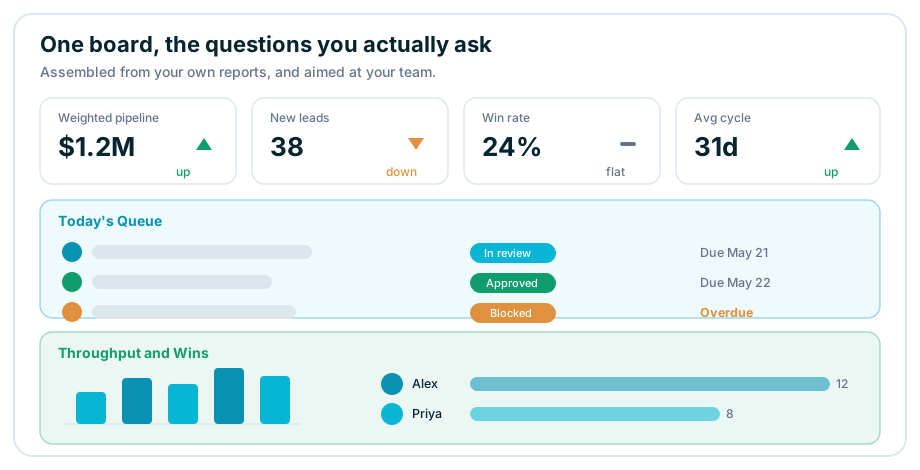
Here is a real one. We built a dashboard for Josh and the design team, three banded sections stacked top to bottom. Today's Queue is what needs a hand right now. My Focus is the work that belongs to you. Throughput and Wins is the scoreboard. It is the board they open first and do not close, because it is shaped like their actual day instead of a demo.
Point it at the right people
A dashboard built for the design team is noise on the finance team's screen. So sharing got precise. The Share dialog now has four settings: Private, Team, Roles, and Organization. Choose Team and a picker lets you name which teams; choose Roles and you grant it to everyone who holds those roles. And it is enforced, not decorative. Someone without a matching team or role cannot open the board at all. You build the view once and aim it exactly where it belongs.
And a hundred small things
The rest of these weeks went into the parts you only notice when they stop fighting you. Global search got a full rebuild. It used to know about a handful of record types and miss everything else, so half your data was invisible to the one box built to find it. Now it searches every entity and every custom field on the record, ranks by relevance, and handles multi-word queries, so "Mike Kerr" finds the contact whose first and last names live in separate columns. Team members are searchable too.
There is a CSV export button on entity lists that respects your active filters and columns, so the file finally matches what is on screen. List columns drag to resize and snap back to the admin default with one click. Relationship fields let you spin up a brand new linked record right inside the form you are already filling out, instead of stopping to go create it somewhere else first. None of those make a headline. All of them are why the export-to-spreadsheet habit quietly dies.
That was the run. A report builder that starts from your question, a dashboard you assemble instead of inherit, sharing that reaches the right people, and a long list of edges filed smooth. The morning we were aiming at looks like this. The number you check is already in the CRM, shaped by you, pointed at your team, and updated while you slept. Your business already keeps score its own way. The software should keep it for you.